Chandigarh Covid-19 Data (Chart representation)
Last Update: 02/10/2020 |
Disclaimer: This information is provided as is without any manipulation for infomation only. However, different calculations have been performed on the data to depict the trends based on the publically available behaviour/physiology/epidemiology details of the virus. The data is collected from public sources and assumed to be accurate. Not for medico-legal purposes. No doctor or health-worker is associated with the presentation of data.
*
This page isn't mobile friendly yet. Working on it :(
With Effect from 04.09.2020, the charts will be shared on weekly basis only.
|
| |
| Daily Confirmed (New positives) till 11/09/2020: |
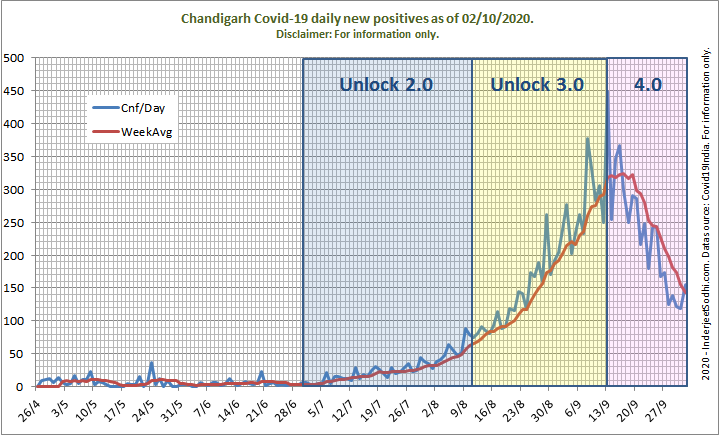
(Weekly Average = Average of previous 7 days) |
|
| |
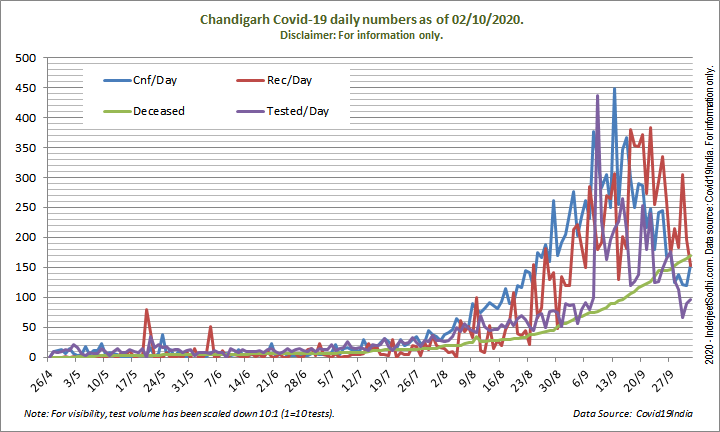
| Daily Confirmed, Recovered, Tested and Deceased till 11/09/2020 chart: |
 |
| |
| Daily New Positives and previous 4 days average till 11/09/2020 chart: |
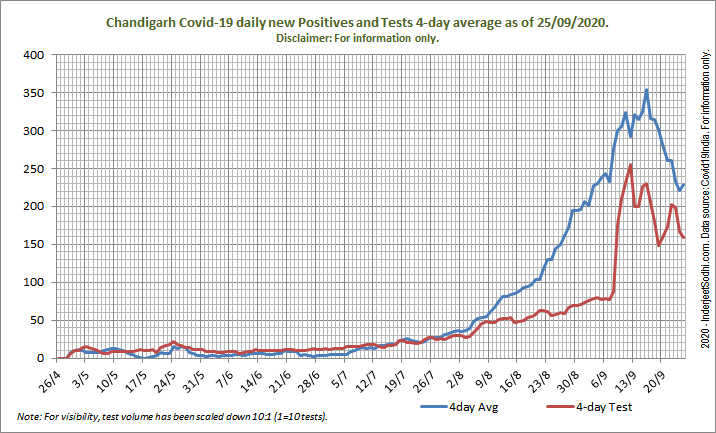
Why 4 days? Any delay in results or miscalculations in handling the tests on the daily basis should get added/corrected eventually within the next 4 days (hopefully). So a cosistent 4 days average would show the correct trend.
|
| |
| Daily Confirmed V/s Tested till 11/09/2020: |
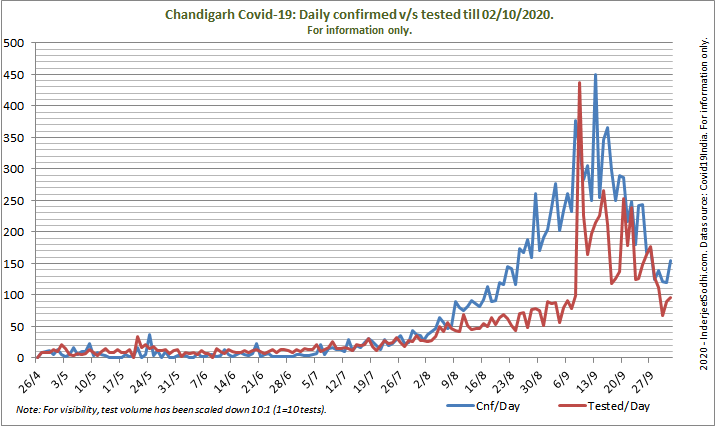
So they say, the higher the testing, the larger number of positive persons will show up. Presumption: Test results take 4 days.
Here is the data speaking for itself.
|
| |
| Weekly Totals till 11/09/2020 |
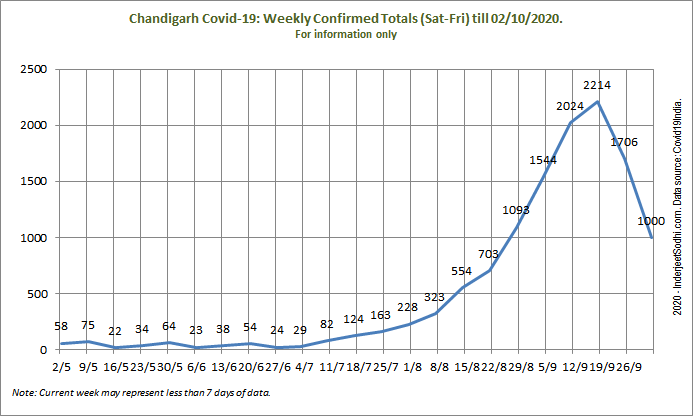
*Weekly totals from Saturday to Friday. Last week total is till date from last Saturday, maybe less than 7 days) |
| |
Contact: inderjeet.chandigarh @ |
| |
| |
| |
| |